Hands-on: OData filters on a Datasphere analytic model
Step by step: filter an analytic model via OData by dimension vs aggregated measure, startswith and contains, top N and $metadata, with sample data.
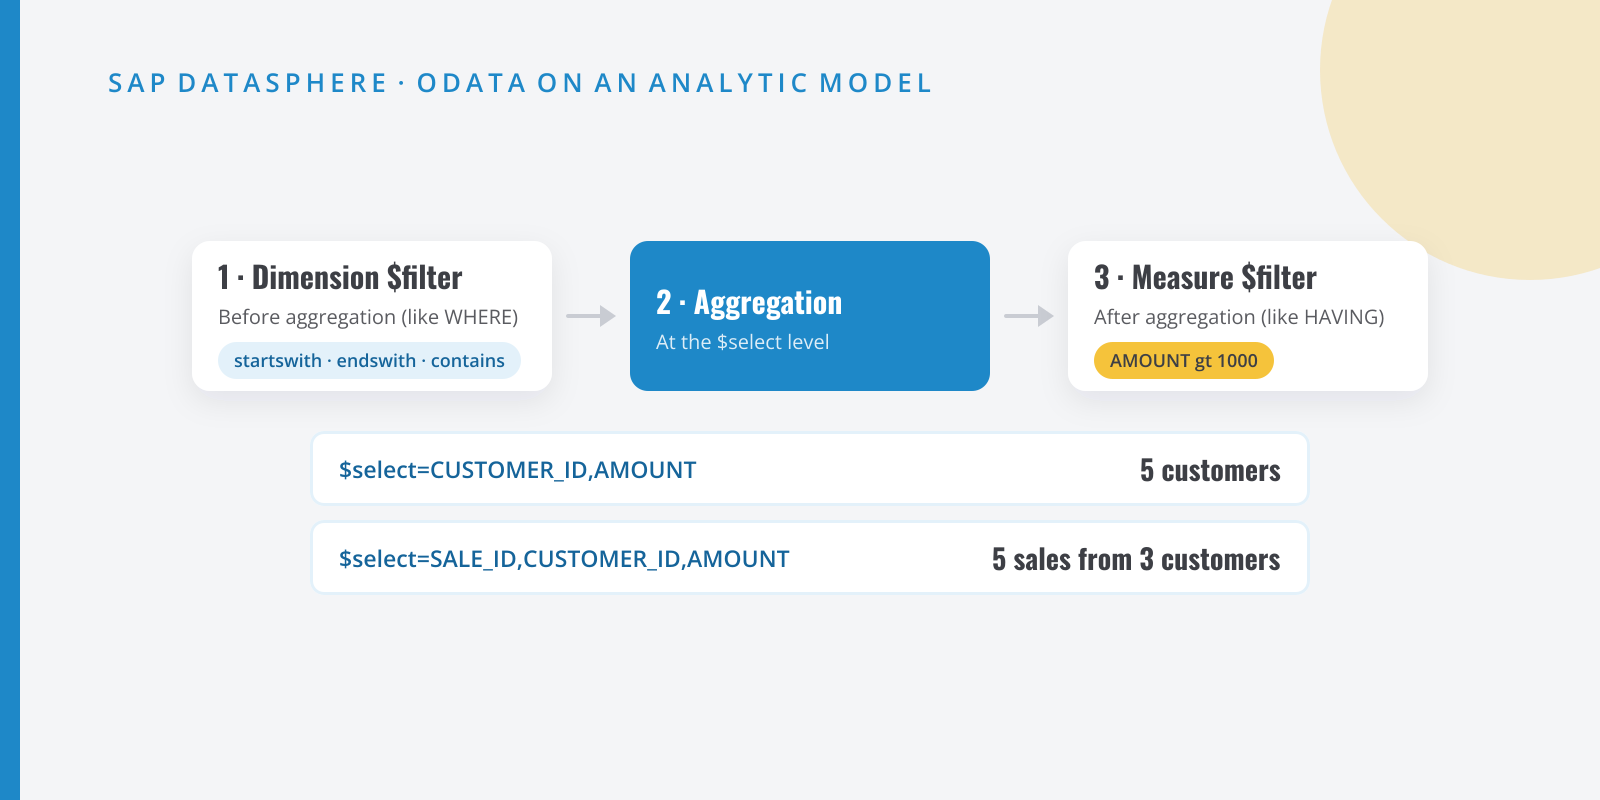
Table of contents
When an SAP Datasphere analytic model has to feed something other than SAP Analytics Cloud (a custom app, a Python script, Power BI), the usual way in is the OData Consumption API. This year SAP added two things that change what you can ask for without downloading everything: filtering on the aggregated value of a measure and partial-match text filters (startswith, endswith, contains). In this hands-on I try both on 24 sample sales rows without leaving the model editor, and show two traps: the same measure filter returns different results depending on the aggregation level you request, and combining it with a dimension filter doesn’t return what you would expect.
What we are going to build
A sales model for a food distributor. By the end you will have:
- A local table
T_FOOD_SALESloaded from a CSV file, a fact viewV_FOOD_SALESand an analytic modelAM_FOOD_SALES. - A set of OData requests run from the model’s Generate OData Request dialog, each with its expected result: dimension filter, measure filter at two aggregation levels, partial text filters, top N and metadata.
All technical names are examples: use your own naming convention.
The key idea, which SAP spells out in the API documentation: filters on dimensions are applied before the cube is generated, and filters on aggregated measures afterwards. If you come from SQL, it is the difference between WHERE and HAVING. SAP adds that measure filtering is more expensive in terms of performance, for exactly that reason. Watch out, though: in my test, combining the two did not behave the way that sentence suggests (more in step 7).
Step by step
Step:Upload the sample data
Download ventas.csv: 24 fictitious sales from July to September 2026, for five customers and six products, adding up to 17,240. I kept customer and product names in the table itself so the case needs a single CSV file; in a real model they would live in dimensions. The values are in Spanish, which is fine for the filters below.
Customer Name Region Amount C001 Supermercados Norte NOR 3,740 C002 Hosteleria Centro CEN 4,660 C003 Tienda Sur SUR 1,540 C004 Cash Levante EST 6,000 C005 Cafeteria Norte NOR 1,300 The product codes follow a deliberate pattern: they start with
CAF(coffee),TE(tea) orACE(olive oil), and the 1 kg coffee products end in1K.In the Data Builder, open the import menu and choose Import CSV File to create
T_FOOD_SALES. In the import editor, check each column’s type under Details. In my test Datasphere got them right first time:SALE_IDandQUANTITYas Integer,AMOUNTas Number andSALE_DATEas Date. SelectSALE_ID, tick Set as Key under Details and deploy.Step:Create the fact view
Create an SQL View
V_FOOD_SALES:V_FOOD_SALES.sql SELECT "SALE_ID", "SALE_DATE", "CUSTOMER_ID", "CUSTOMER_NAME","REGION_ID", "PRODUCT_ID", "PRODUCT_NAME","QUANTITY", "AMOUNT"FROM "T_FOOD_SALES"Set Semantic Usage = Fact, validate the SQL so the attributes show up, and move
AMOUNTandQUANTITYto Measures (drag them, or use the attribute’s ··· menu, Change to Measure). In the same menu forSALE_ID, choose Set as Key. The other columns stay as attributes. Deploy.Step:Create and deploy the analytic model
Create the analytic model
AM_FOOD_SALESby draggingV_FOOD_SALESonto the canvas. In the add dialog keep Add all attributes and Add all measures ticked, and deploy: the API only serves deployed models.In the Preview tab, with nothing in rows, you should see the grand total: 17,240 for
AMOUNT(and 1,385 forQUANTITY). UntickQUANTITY, putCUSTOMER_IDin rows and you get the customer table from step 1. If it does not match, check the import data types before moving on.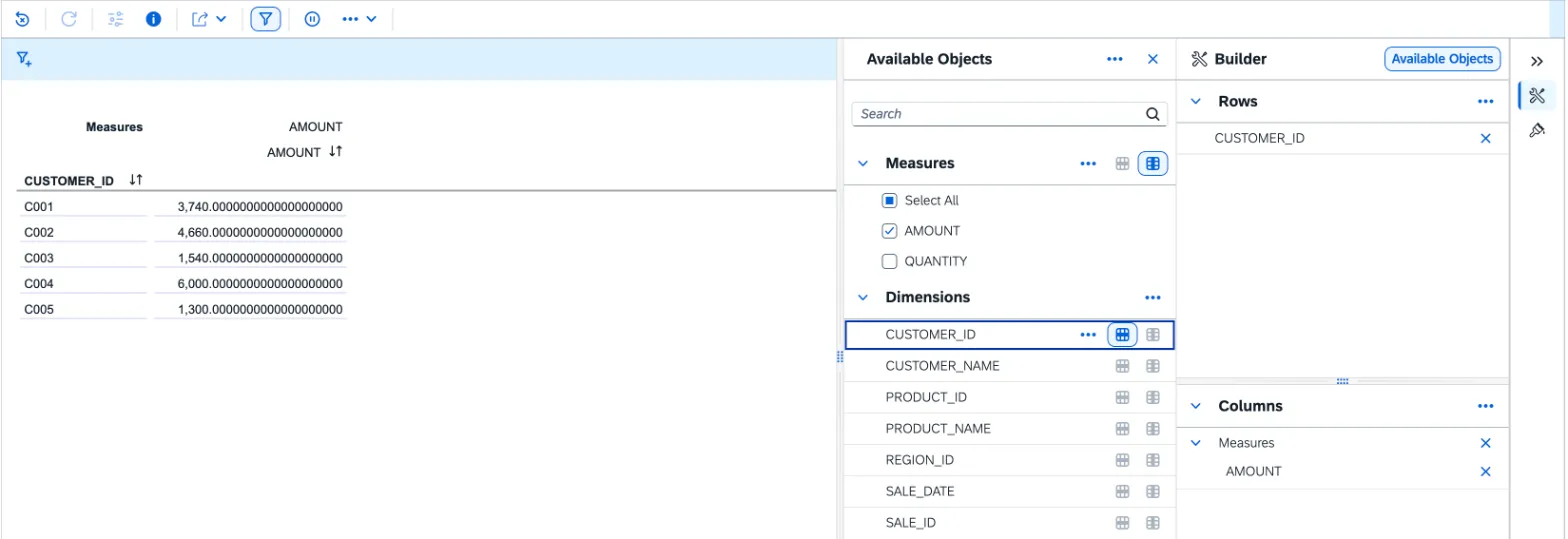
AM_FOOD_SALES preview by customer: the same amounts as the table in step 1. Step:Open Generate OData Request and run the first request
In the
AM_FOOD_SALESeditor (Model mode), click Generate OData Request in the toolbar. Keep Request = Data. Under Query Parameters, the Name drop-down offers$filter,$orderby,$select,$skip,$topandsap-language; each one you pick is added as a row and its Value is free text. Add$selectwithCUSTOMER_ID,AMOUNTand click Preview: the dialog shows the JSON response, limited to 100 records, more than enough here. Configure takes you back to the parameters.The generated URL looks like this:
Base request https://<tenant>/api/v1/datasphere/consumption/analytical/<space>/AM_FOOD_SALES/AM_FOOD_SALES?$select=CUSTOMER_ID,AMOUNTOn an analytic model,
$selectdoes more than pick columns: it sets the aggregation level. With one measure and one attribute you get the measure aggregated per attribute value; withAMOUNTalone, the grand total. You should see the five customers with their amounts.Step:Filter on a dimension
Add the
$filterparameter withREGION_ID eq 'NOR', keeping$select=CUSTOMER_ID,AMOUNT:Dimension filter ?$select=CUSTOMER_ID,AMOUNT&$filter=REGION_ID eq 'NOR'Result: C001 with 3,740 and C005 with 1,300. The filter removes rows before aggregation, like a
WHERE.Single quotes around text values are mandatory. Without them (
REGION_ID eq NOR) the API readsNORas a property name and returnsSERVICE_BAD_REQUEST: Property ‘NOR’ does not exist in type ‘InaApplicationService.AM_FOOD_SALES’.Step:Filter on a measure at two aggregation levels
Now the new part. Change the filter to
AMOUNT gt 1000:Measure filter per customer ?$select=CUSTOMER_ID,AMOUNT&$filter=AMOUNT gt 1000Result: all five customers, with their full totals, because each of them adds up to more than 1,000. The filter is evaluated on the amount already aggregated per customer: if it were evaluated sale by sale, C003 and C005 would disappear. Raise the threshold to
AMOUNT gt 3000and three remain: C001 (3,740), C002 (4,660) and C004 (6,000). The response is sorted by customer, not by amount.Go back to
AMOUNT gt 1000and addSALE_IDto$select:Same filter, per sale ?$select=SALE_ID,CUSTOMER_ID,AMOUNT&$filter=AMOUNT gt 1000Result: five sales from only three customers: 1001 and 1002 from C001 (1,200 each), 1006 from C002 (1,800), and 1015 (2,000) and 1016 (1,800) from C004. C003 and C005 disappear: their totals exceed 1,000, but none of their individual sales does.
Same condition, different business question: “customers billing more than 1,000” versus “sales above 1,000”. In an integration, this is the first thing I would agree with whoever consumes the data.
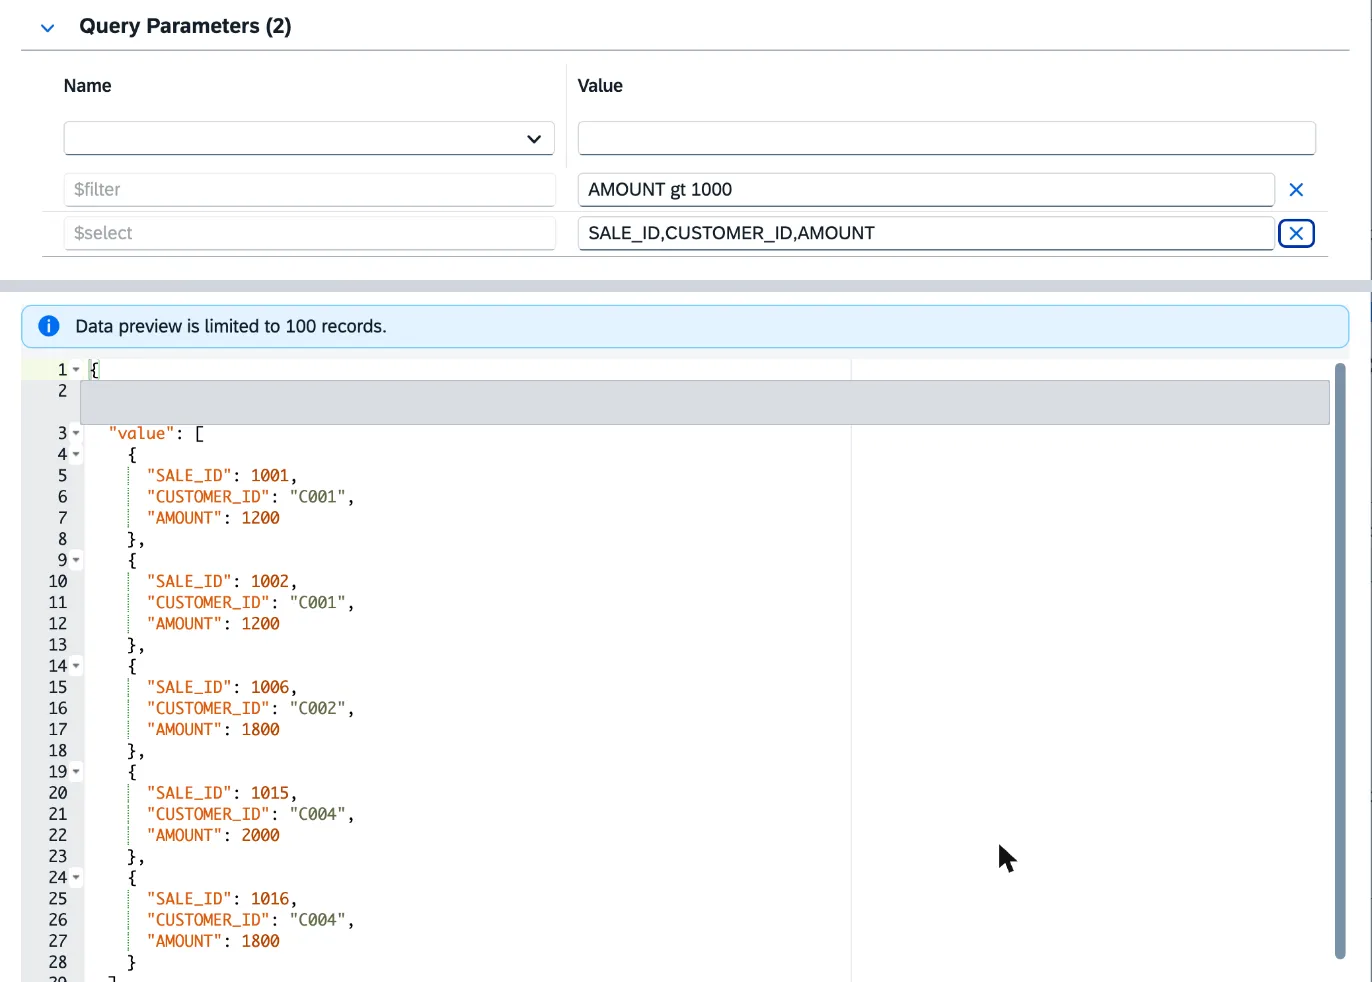
Top, the parameters; bottom, the Preview: five sales from three customers. I have hidden the line with the tenant URL. Step:Combine partial text filters with a measure filter
Partial filters work on text attributes. Ask for coffee sales per customer and keep the customers above 1,000 in coffee:
Coffee per customer, above 1,000 ?$select=CUSTOMER_ID,AMOUNT&$filter=startswith(PRODUCT_ID,'CAF') and AMOUNT gt 1000I expected four customers: C002 (3,500), C004 (2,800), C001 (1,800) and C005 (1,090), with C003 dropping out on its 360 of coffee. That is not what comes back. All five are returned, C003 included with 360:
Customer Amount returned (coffee only) Customer total (everything) C001 1,800 3,740 C002 3,500 4,660 C003 360 1,540 C004 2,800 6,000 C005 1,090 1,300 The amount returned is the coffee amount, but the
AMOUNT gt 1000condition was compared with the customer’s total across all products. I confirmed it by raising the threshold toAMOUNT gt 5000: it returns only C004, with 2,800, because it is the only customer above 5,000 overall.eqbehaves the same:PRODUCT_ID eq 'CAF-MOL-1K' and AMOUNT gt 1000returns four customers, including C003 (360) and C005 (240).It works as you would expect if the filtered dimension is also in
$select. With$select=CUSTOMER_ID,PRODUCT_ID,AMOUNTand the sameCAF-MOL-1Kfilter you get only C001 (1,200) and C004 (1,800). Step 5 didn’t show it because each customer has a single region, so the per-customer total is the same with or without the filter.This clashes with what SAP says (the dimension is filtered before the cube is generated), so it may be a bug that gets fixed. Meanwhile, in an integration: if you combine a dimension filter with a measure filter, put that dimension in
$selectand aggregate on the client if you need a higher level.Try the other two functions as well, without a measure filter, with
$select=PRODUCT_ID,AMOUNT,PRODUCT_NAME,AMOUNTorCUSTOMER_NAME,AMOUNT:$filterResult endswith(PRODUCT_ID,'1K')CAF-GRA-1K 3,750 and CAF-MOL-1K 3,600 contains(PRODUCT_NAME,'grano')Cafe en grano 1 kg 3,750 contains(CUSTOMER_NAME,'Norte')Cafeteria Norte 1,300 and Supermercados Norte 3,740 The documentation doesn’t say whether these functions are case-sensitive. In my test they are not:
contains(CUSTOMER_NAME,'norte')returns the same two customers andstartswith(PRODUCT_ID,'caf')the three coffee products.Step:Sort and limit: the top 3 customers
Top 3 customers by amount ?$select=CUSTOMER_ID,AMOUNT&$orderby=AMOUNT desc&$top=3Result: C004 (6,000), C002 (4,660) and C001 (3,740). Adding
$skip=3with the same ordering gives you the next two: C003 (1,540) and C005 (1,300). What does not work on an analytic model is$count=true: SAP states it is not supported for analytical requests, the dialog drop-down doesn’t even offer it, and the metadata declaresCountable = false.Step:Check the metadata
In the same dialog, switch Request to Metadata and click Preview. You get the XML definition of the service: an
EntityTypewith one property per measure and attribute, each with its type (AMOUNTasEdm.Decimal,QUANTITYasEdm.Int64,SALE_DATEasEdm.Date…), plus capability annotations such as the one for$count. Since 2026.10, SAP also adds information about the definition of variables and filters; this model has none, so none shows up here.Use it to check the exact property names before writing a
$filter. Here they match the view columns, but when the model brings in associated dimensions with texts, Datasphere generates the text column name and it can change on redeployment. We saw that in the multilingual texts hands-on.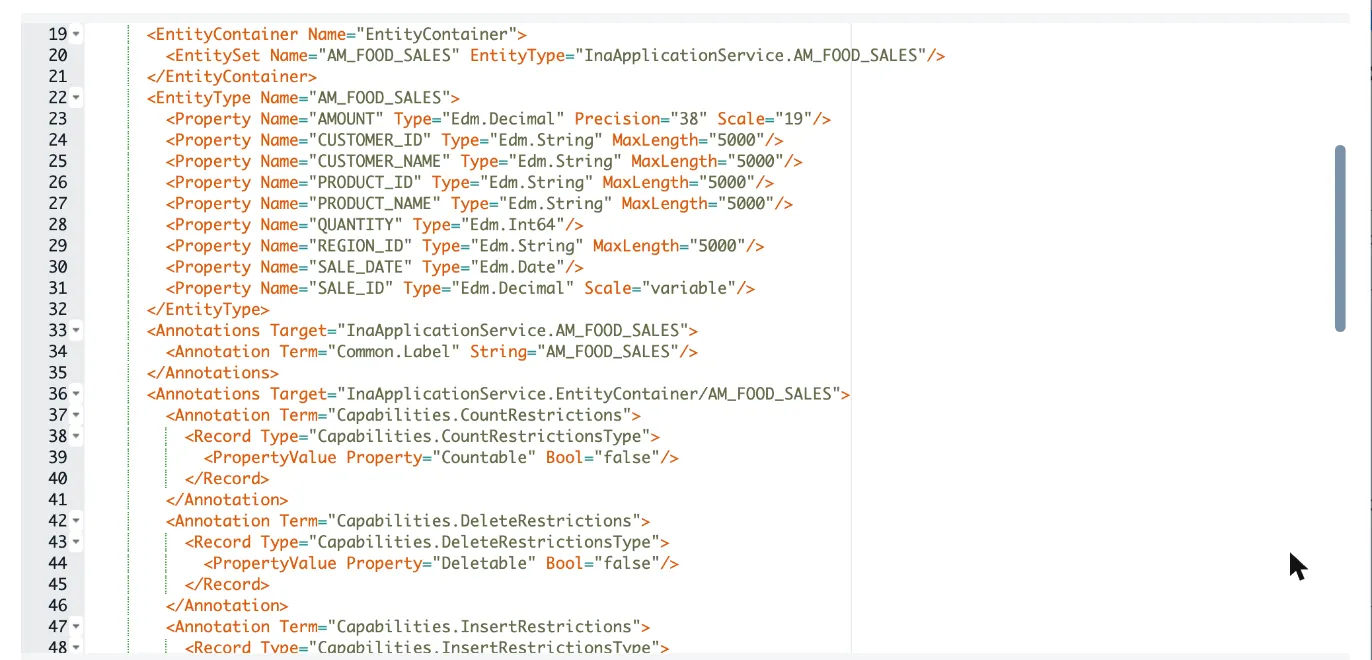
AM_FOOD_SALES metadata: property names and types, and Countable = false.
Validation
This is what each request returned in my tenant with the sample data:
Request ($select · $filter / other) |
Rows | Result |
|---|---|---|
AMOUNT |
1 | 17,240 |
CUSTOMER_ID,AMOUNT |
5 | Table from step 1 |
CUSTOMER_ID,AMOUNT · REGION_ID eq 'NOR' |
2 | C001 3,740 · C005 1,300 |
CUSTOMER_ID,AMOUNT · AMOUNT gt 1000 |
5 | All five customers |
CUSTOMER_ID,AMOUNT · AMOUNT gt 3000 |
3 | C001 · C002 · C004 |
SALE_ID,CUSTOMER_ID,AMOUNT · AMOUNT gt 1000 |
5 | Sales 1001, 1002, 1006, 1015, 1016 |
CUSTOMER_ID,AMOUNT · startswith(PRODUCT_ID,'CAF') and AMOUNT gt 1000 |
5 | All five, with the coffee amount |
CUSTOMER_ID,PRODUCT_ID,AMOUNT · PRODUCT_ID eq 'CAF-MOL-1K' and AMOUNT gt 1000 |
2 | C001 1,200 · C004 1,800 |
CUSTOMER_ID,AMOUNT · $orderby=AMOUNT desc&$top=3 |
3 | C004 · C002 · C001 |
To cross-check, the model’s Preview tab supports filters (Add Filter) and, since 2026.20, export to Excel or CSV, unless data export is protected in the model properties. One detail for when you integrate: the same SAP page says in one section that requests return the first 10 results by default and, in the analytical data section, that up to 50,000 records are returned. Don’t rely on the default: always request $top and follow @odata.nextLink to page.
Common mistakes
| Symptom | Cause | Fix |
|---|---|---|
| The measure filter “doesn’t filter” what you expected | It is evaluated on the value aggregated at the $select level |
Decide the level first (customer, sale…) and adjust $select |
| You combine a dimension filter and a measure filter and get rows that fail the condition | The measure condition was compared with the total without the dimension filter (behaviour observed in step 7) | Put the dimension you filter on in $select |
Error Property 'NOR' does not exist |
Text value without single quotes: the API reads it as a property name | Write REGION_ID eq 'NOR' |
Error when using $count=true |
Not supported for analytical requests | Count on the client or use an exposed view with a relational request |
startswith, contains or gt fail on another model |
A source in the lineage is not replicated into Datasphere: $filter then only supports eq, and, or and brackets, and there is no $count, $top or $skip |
Replicate the source or filter at source; check the lineage with Impact and Lineage Analysis |
Error with a value such as O'Brien |
The API does not support values containing single quotes | Filter on the code, not the text |
| The copied URL fails authentication in the browser | Tenant in a BDC formation: explicit OAuth required | Use the dialog Preview or an OAuth client |
Property ... does not exist |
Property name differs from what you assume (e.g. text columns) | Check the real name with Request = Metadata |
Wrap-up
My take after trying it: the measure filter is the most useful improvement to this API in a long time, because it saves you from downloading everything just to keep “the customers above X”. Use it wisely, though. Filter on dimensions as much as you can, because it is cheaper. Keep the measure filter for the question that really needs it, and write down in the integration spec which level the data is aggregated at. And if you combine it with a dimension filter, check the result against data you know: in my test, without that dimension in $select, it returned rows that didn’t meet the condition. And if the consumer will make many calls, mind SAP’s limit: roughly 300 requests per user per minute, with an HTTP 429 response when exceeded.
The natural next step is to run these requests from an external client with a technical-user OAuth client. Mind the security: with that kind of client, data access controls are evaluated with the user ID associated with the OAuth client, so give that ID the permissions it needs.