Hands-on: non-additive measures in a Datasphere Analytic Model
Step by step with count distinct, calculated measures, GrandTotal and exception aggregation in a Datasphere Analytic Model, validated by exporting the preview.
Table of contents
“The customers per region don’t add up to the total.” I have heard that sentence on every BI project I have worked on, and it is almost never a bug: it is a non-additive measure being treated as if it were additive. Distinct customers, average price, share of total or best month cannot be summed row by row. In this hands-on I build those four measures in an SAP Datasphere Analytic Model, check with sample data that the model calculates them correctly, and use the data preview export to show the business why the total is not the sum of the rows.
What we’ll build
A minimal sales model for a distributor. By the end you will have:
- A local table
T_SALES_KPIloaded from CSV and a viewFV_SALES_KPIwith semantic usage Fact. - An Analytic Model
AM_SALES_KPIwith five measures that don’t add up: distinct customers, average sales per customer, average price, share of total and best-month sales. - A check view
V_CHECK_NAIVEthat calculates the same things “the easy way” in SQL, for comparison. - The model’s data preview exported to CSV, with the expected values listed in this post.
All technical names are examples: use your own naming convention.
Before we start, one idea explains everything. SAP documents the order in which the Analytic Model calculates a measure: first the standard aggregation, then the formula, and finally the exception aggregation. In other words, formulas run on data already aggregated to the level you are looking at, not row by row. That is the difference from doing it in SQL.
Step by step
Step:Upload the sample data
Download ventas_kpi.csv: 15 fictitious sales from July to September 2026 across three regions (
NORTE,SUR,ESTE), with six customers and a total of 12,400. The key point is that two customers buy in more than one region:C01in all three andC06inNORTEandESTE. That is normal for a distributor whose customers run several stores.In the Data Builder, choose Import → Import CSV File, pick the file with Select Source File and click Upload. Before deploying, check each column in the Details tab:
SALE_MONTHmust be String. In my test it was detected as Date with formatYYYY-MM: change it, because “2026-07” is a month label here, not a day.AMOUNTmust be Number (the file uses two decimals to help detection). It was detected correctly in my test; if you get Integer, change it.QUANTITY, Integer (also detected correctly).- On
SALE_ID, select Set as Key.
Deploy it as
T_SALES_KPI.Step:Create the Fact view
Create a SQL View
FV_SALES_KPI:FV_SALES_KPI.sql SELECT "SALE_ID", "SALE_DATE", "SALE_MONTH", "REGION_ID","CUSTOMER_ID", "QUANTITY", "AMOUNT"FROM "T_SALES_KPI"Set Semantic Usage = Fact. In the ⋯ menu of
AMOUNTandQUANTITY, choose Change to Measure (default aggregation, sum). The other columns stay as attributes. Deploy.I deliberately calculate nothing in this view. Everything that doesn’t add up goes into the Analytic Model, which knows the level the user is looking at.
Step:Create the Analytic Model with the base measures
Choose New Analytic Model and drag
FV_SALES_KPIonto the canvas. In the dialog, keep the options to add all attributes and all measures selected and click Add. Save it asAM_SALES_KPI.You now have
AMOUNTandQUANTITY, which do add up, and the fact attributes, which act as dimensions in the Analytic Model. KeepREGION_ID,CUSTOMER_IDandSALE_MONTH: the measures will need them.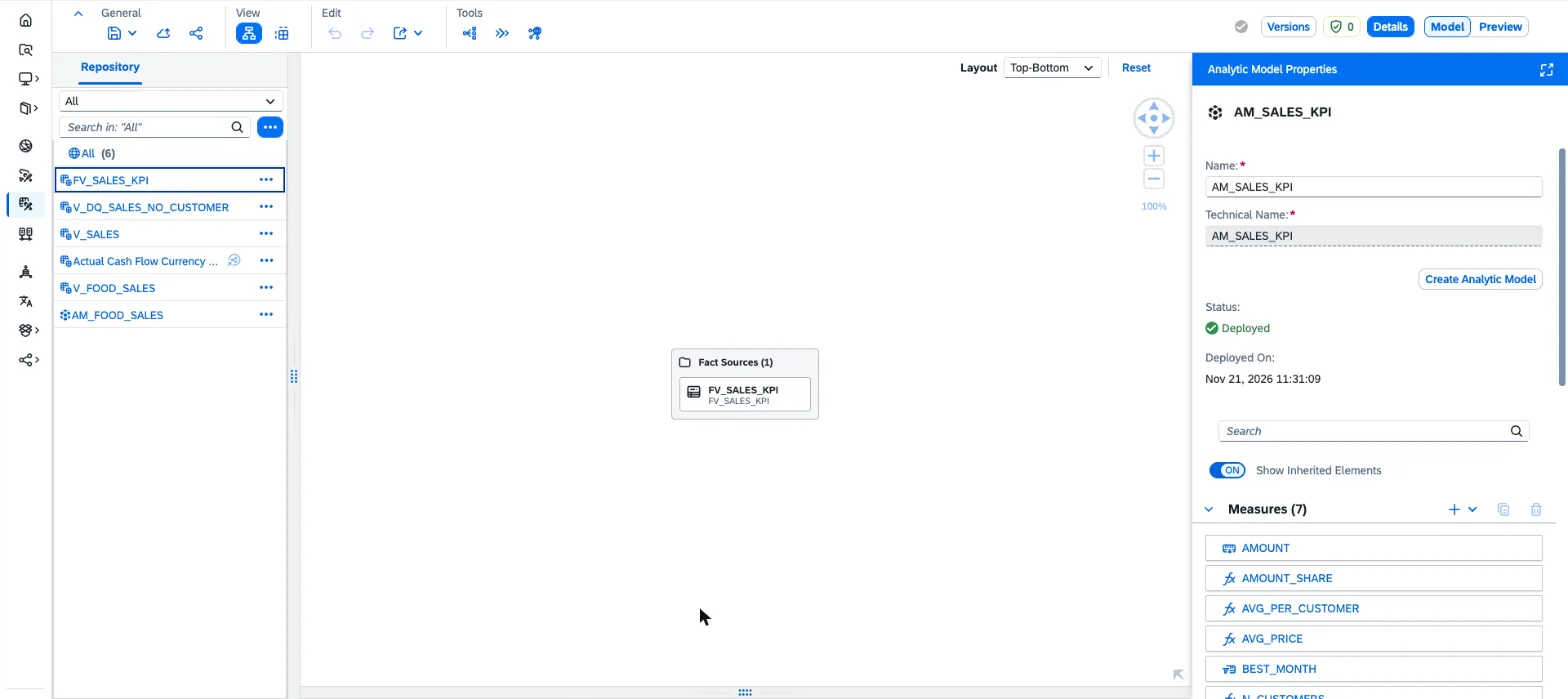
The finished AM_SALES_KPI: a single fact source and the measures from this guide in the properties panel. Step:Distinct customers and average sales per customer
Click the canvas background and, in the properties panel, click the + in the Measures section. The menu offers Calculated Measure, Restricted Measure, Count Distinct Measure, Conversion Measure and Non-Cumulative Measure:
- Count Distinct Measure
N_CUSTOMERS(business name “Distinct customers”). Under Dimensions, pickCUSTOMER_ID; until you do, the field is flagged in red. SAP notes that this measure only counts booked values. - Calculated Measure
AVG_PER_CUSTOMER(“Average sales per customer”), with the expressionAMOUNT / N_CUSTOMERS. Click Validate to check the expression. In my test the preview already showed it with two decimals without touching Formatting.
Watch what happens in the total. Each region has 3 distinct customers:
Region Customers Distinct customers NORTE C01, C02, C06 3 SUR C01, C03, C04 3 ESTE C01, C05, C06 3 Sum 9 Total C01 to C06 6 Adding them up gives 9, but the correct total is 6.
C01buys in all three regions and counts as a customer in each one (1 + 1 + 1), andC06in two, while in the total each of them is one customer. And the average sales per customer in the total (12,400 / 6 = 2,066.67) is higher than in any region. It looks wrong and it is exactly right.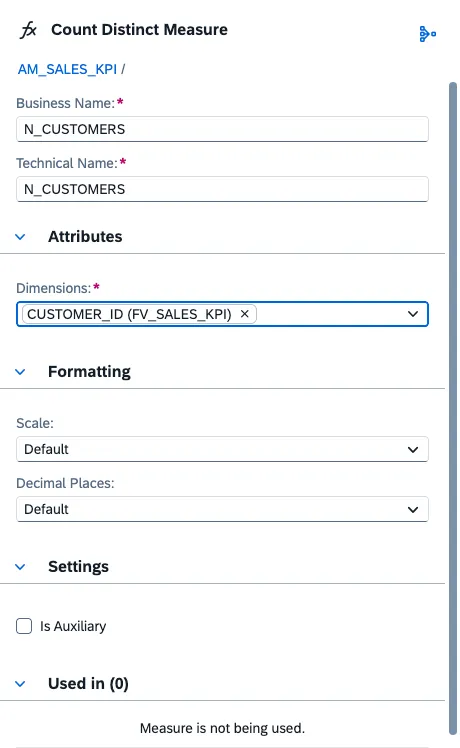
N_CUSTOMERS: a Count Distinct Measure on CUSTOMER_ID. - Count Distinct Measure
Step:Average price and share of total
Add two more Calculated Measures:
AVG_PRICE(“Average price”):AMOUNT / QUANTITY. Because the formula runs after aggregation, this is a weighted average price: total amount divided by total units. Averaging the price of each sale gives a different figure, as the check view will show.AMOUNT_SHARE(“Share of total, %”):AMOUNT / GrandTotal(AMOUNT) * 100. GrandTotal returns the grand total of the result set, so each region is divided by 12,400. With this syntax, Validate answers The expression is valid.
I multiply by 100 in the formula so as not to depend on how the Percent scale under Formatting is displayed. If you prefer that scale, check it in the preview. SAP’s function list also includes
PercentOfGrandTotal, which does this calculation directly.Step:The best month, with exception aggregation
We want the sales of each region’s best month: sum by month and keep the maximum. A standard MAX aggregation won’t do, because it would return the largest single sale. This is exactly what exception aggregation solves: first aggregate with the standard rule to the level of a dimension, then apply a different rule.
Add a Restricted Measure
BEST_MONTH(“Best-month sales”):- Source Measure:
AMOUNT. Leave Aggregation Type as Inherited (SUM). - Expression: empty. SAP explicitly allows a restricted measure with no restrictions, used only for its exception aggregation, and the editor accepts it (The expression is valid).
- Exception Aggregation: under Exception Aggregation Type, MAX (the list also has SUM, MIN, COUNT, AVG, FIRST, LAST and more). Exception Aggregation Dimensions then becomes mandatory: pick
SALE_MONTH.
In a restricted measure, exception aggregation is only supported if the source measure is a fact source measure, as
AMOUNTis. Save and deploy the model: the first time you click Deploy, it asks for the name and then deploys straight away.In the total, the model does the right thing again: it sums all regions by month and keeps the maximum (August, 4,900). It is neither the sum of each region’s best month (6,200) nor the largest of them (3,100).
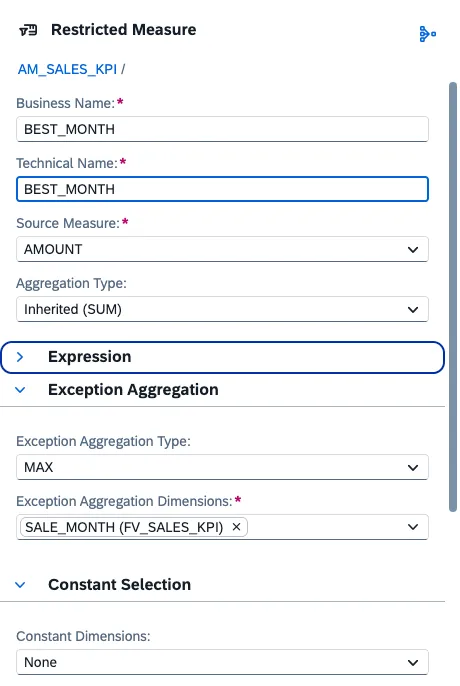
BEST_MONTH: standard sum of AMOUNT first, then the maximum by SALE_MONTH. - Source Measure:
Step:Build the 'easy way' check view
To have something to compare against, create a SQL View
V_CHECK_NAIVEwith what anyone who pre-calculates KPIs in SQL would do:V_CHECK_NAIVE.sql SELECT r."REGION_ID", r."N_CUSTOMERS", r."AVG_ROW_PRICE", m."BEST_MONTH"FROM (SELECT "REGION_ID",COUNT(DISTINCT "CUSTOMER_ID") AS "N_CUSTOMERS",ROUND(AVG(CAST("AMOUNT" AS DECIMAL(15,2)) / "QUANTITY"), 2) AS "AVG_ROW_PRICE"FROM "T_SALES_KPI"GROUP BY "REGION_ID") AS rINNER JOIN (SELECT "REGION_ID", MAX("MONTH_AMOUNT") AS "BEST_MONTH"FROM (SELECT "REGION_ID", "SALE_MONTH", SUM("AMOUNT") AS "MONTH_AMOUNT"FROM "T_SALES_KPI"GROUP BY "REGION_ID", "SALE_MONTH") AS xGROUP BY "REGION_ID") AS mON r."REGION_ID" = m."REGION_ID"Keep Semantic Usage = Relational Dataset, deploy it and open the data preview. Per region, customers (3, 3, 3) and best month (1,500, 1,600, 3,100) match the model. The trouble starts when someone sums these rows, in a story or in Excel: 9 customers and 6,200 for the best month. And the average of per-sale prices (
AVG_ROW_PRICE) doesn’t match even per region, because a 1-unit sale weighs the same as a 30-unit one.Step:Review the preview and export it
Open the Analytic Model’s Preview tab. By default it shows the seven measures in columns and a single total row. Under Available Objects, click the rows icon next to
REGION_ID. Then, in the Builder panel, open the ⋯ menu ofREGION_IDitself inside Rows (not the one in the Rows header) and choose Totals → Show Totals.Next, open the export menu in the preview toolbar and choose Export CSV… (or Export Excel…). SAP positions this export precisely for this: sharing intermediate results and validating calculations and measures. If it isn’t there, check the Allow Data Export switch under Advanced Properties in the model properties. It was on in the trial.
A visual detail:
AMOUNTandBEST_MONTHshow every decimal of the imported column, while the calculated measures show two.Open the file in Excel and run the test the business will run: sum the three region rows of each column and compare that with the model’s total row.

The preview with totals: 6 customers and 4,900 for the best month, not 9 or 6,200.
Validation
With the sample data, the AM_SALES_KPI preview by region should return (these are the values I got in the trial):
| REGION_ID | AMOUNT | QUANTITY | N_CUSTOMERS | AVG_PER_CUSTOMER | AVG_PRICE | AMOUNT_SHARE | BEST_MONTH |
|---|---|---|---|---|---|---|---|
| ESTE | 3,600 | 30 | 3 | 1,200.00 | 120.00 | 29.03 | 1,500 |
| NORTE | 3,800 | 37 | 3 | 1,266.67 | 102.70 | 30.65 | 1,600 |
| SUR | 5,000 | 60 | 3 | 1,666.67 | 83.33 | 40.32 | 3,100 |
| Total | 12,400 | 127 | 6 | 2,066.67 | 97.64 | 100.00 | 4,900 |
And this is what you get if you sum the region rows in the exported file, or use the check view:
| Measure | Model total | Sum of rows / “easy” calculation | Why |
|---|---|---|---|
| Distinct customers | 6 | 9 | C01 and C06 buy in several regions |
| Best month | 4,900 | 6,200 | Each region’s best month is a different month |
| Average price (total) | 97.64 | 116.94 (mean of per-sale prices) | A simple mean doesn’t weight by units |
| Average price (region) | 120.00 · 102.70 · 83.33 | 124.83 · 122.33 · 103.67 (AVG_ROW_PRICE) |
Same issue, already per region |
| Share of total | 100.00 | 100.00 | This one adds up: the parts of a total sum to the total |
Two extra checks I recommend:
- Swap
REGION_IDforSALE_MONTHin rows. Distinct customers is 4 in each month and 6 in the total, andBEST_MONTHrepeats each month’s sales (4,500, 4,900 and 3,000), because at month level the maximum of a single value is that value. - Filter one region with the preview’s filter icon (Dimensions → REGION_ID) and look at
AMOUNT_SHARE. SAP defines GrandTotal as the grand total of the values in the result set, and that is how it behaves: withNORTEfiltered and months in rows, the total shows 100.00 and the months split 42.11, 28.95 and 28.95 over 3,800, not over 12,400. Tell the business before they find out in a filtered story.
Common errors
| Symptom | Cause | Fix |
|---|---|---|
| Total customers equals the sum of the regions | The count is pre-calculated in SQL, or summed in Excel or in the story | Use a Count Distinct Measure in the Analytic Model and don’t re-aggregate its exported values |
| Average price doesn’t match amount / units | Average of per-row ratios instead of a ratio of totals | Calculated Measure AMOUNT / QUANTITY: the formula runs after aggregation |
BEST_MONTH returns the same as AMOUNT |
SALE_MONTH is missing as the exception aggregation dimension |
Check Exception Aggregation on the measure and that SALE_MONTH is still in the model |
| A calculated measure shows no data | It is based on a dimension that isn’t included in the Analytic Model | SAP says to include the dimension the calculation is based on in the model |
| No export option in the data preview | Exporting the data preview is protected in the model properties | Check Allow Data Export under Advanced Properties, if your data policy allows it |
| Slow preview with exception aggregation | Many dimensions in the exception aggregation | SAP warns about the performance impact: use only the ones you need |
Wrap-up
Non-additive measures are not a technical problem but a communication one: the model calculates correctly and someone sums what shouldn’t be summed. My recommendation: define everything that depends on the aggregation level (distinct counts, ratios, shares, maximums per period) in the Analytic Model, never in the Fact view or in each story. Before you show it to the business, export the data preview with totals switched on and keep the “why it doesn’t add up” table next to the model documentation. It saves a lot of meetings.
The natural next step is to apply the same logic to stock with non-cumulative measures: the classic example of a value that describes a state and doesn’t add up over time either.
Sources
- What’s New in SAP Datasphere (SAP Help Portal)
- Create a Measure in an Analytic Model (SAP Help Portal)
- Create a Count Distinct Measure (SAP Help Portal)
- Create a Calculated Measure (SAP Help Portal)
- Functions for Calculated Measures (SAP Help Portal)
- Create a Restricted Measure (SAP Help Portal)
- Aggregation and Exception Aggregation (SAP Help Portal)
- Preview Data in an Analytic Model (SAP Help Portal)
- Creating an Analytic Model (SAP Help Portal)
- Dimensions in the Analytic Model (SAP Help Portal)
- Creating a Local Table from a CSV File (SAP Help Portal)